Hypothesis
“In hotter regions, more people are
likely to buy perfumes”

Visualization
Perfume Sales In High Temperature Regions (globaly)
Region
Perfume Sales Index))
75%
50%
40%
45%

60%
55%
Average Annual Temperature (°C)
35 °C
30 °C
10 °C
15 °C
35%
Showing the sales ratio of perfumes in different hot regions. Perfume sales in hot regions such as the Middle East and Africa are high, while perfume sales in Australia and Europe are relatively low.

Relationship Between Temperature
(Latitude) and Perfume Use
Agentina
Singapore
Nigeria
Thailand
Turkey
Latitude is used as an approximation of temperature because the lower the latitude, the higher the temperature generally.
Singapore → Closest to the equator, highest temperature
Nigeria → Low latitude, warm area
Thailand→ Low latitude, warm area
Argentina → Mid-latitude in the southern hemisphere, lower temperature
Turkey → High latitude in the northern hemisphere, lowest temperature

Latitude (procy for temperature)
Plot temperature on one axis and perfume sales on the other to see if there’s a link.
Temperature and Perfume Sales Volume by Region


Perfume Use Index
Agentina
Nigeria
Singapore
Thailand
Turkey
Latitude

Bubble Size: Shows how much perfume is used (bigger bubbles mean more sales).
Color: Warmer colors (red) are used for more extraordinary places, and cooler colors (blue) are used for hotter places.
Key Points:
- Turkey uses the most perfume and is red due to its extraordinary location.
- Singapore, the hottest, uses the least perfume and is blue.
- Argentina, Nigeria, and Thailand have mixed sales and temperatures.
Monthly Perfumes Sales in
Turkey
Argentina
Singapore
Nigeria
Thailand
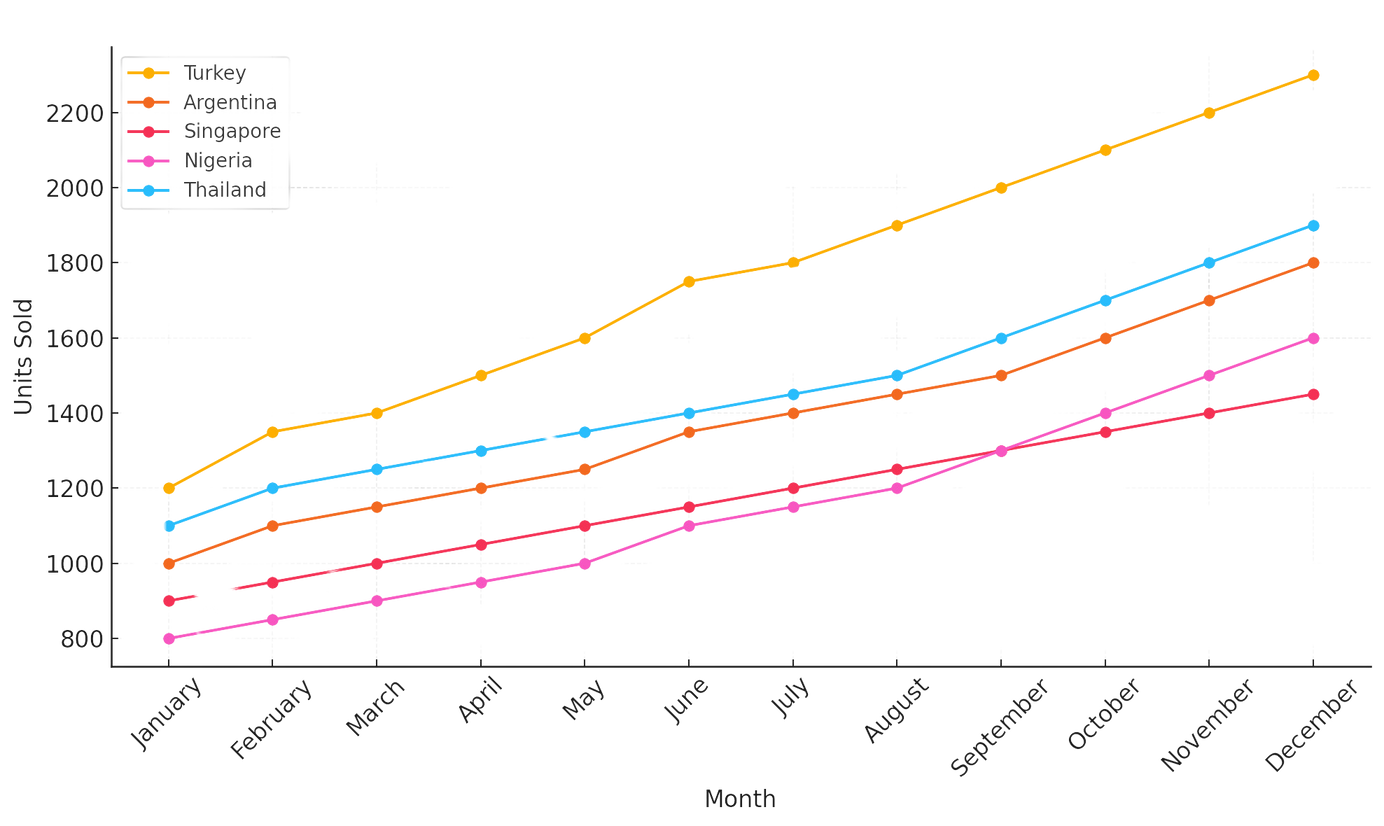

This chart shows perfume sales in Turkey by month. Sales increase in warmer months, peaking in July and August, and drop in colder months like January and December. It highlights that people use more perfume in hot weather.
My hypothesis was verified based on the visualization, first from the global comparison, and then picked a few countries that were worth comparing. Finally, I chose Turkey as an example, which confirmed the hypothesis that the hotter the area, the higher the frequency of perfume use. I hope my visualization also makes sense to you, and I hope you have much fun on this website. Thank you for your company!

- Angel Wang
